
 Available in US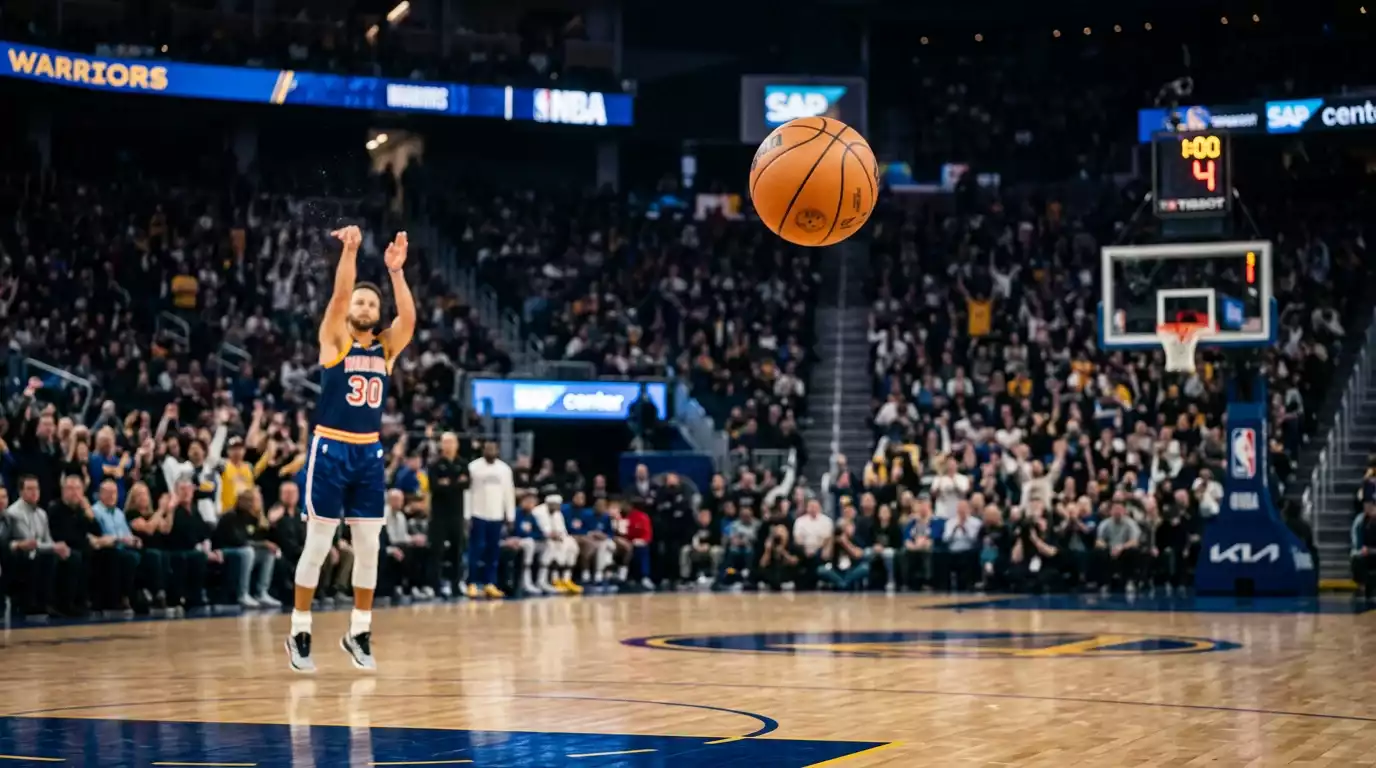
They shot 48% from three in the first half and 26% in the second. Same shooters, same looks, wildly different results. That game crystallised everything I needed to understand about three-point variance and its implications for NBA betting.
The three-point revolution has transformed NBA basketball into a higher-variance sport than previous eras. Teams launching 35-45 threes per game create scoring volatility that spreads and totals struggle to capture. Understanding how three-point shooting affects game outcomes, and when the variance creates betting opportunities, provides edges unavailable to those still thinking in two-point terms.
Three-point variance works both ways. Hot shooting nights produce blowouts from unlikely sources. Cold shooting collapses contenders unexpectedly. Learning to identify when variance has distorted results, and when markets have failed to adjust for likely regression, separates sophisticated bettors from those confused by modern basketball’s randomness.
Tracking three-point performance across the league reveals which teams run hot or cold relative to their expected levels. This regression analysis identifies value in upcoming games where recent results mislead about true team quality.
The NBA’s Three-Point Revolution
Watching old games shocked me. Teams shooting fifteen threes per game seemed bizarrely conservative compared to today’s approach.
The three-point revolution has fundamentally changed how NBA teams construct offences, with volume increasing dramatically over the past decade. Teams now routinely attempt 35-45 threes per game, representing roughly 40% of their total shot attempts. This strategic shift reflects mathematical reality: three points exceeds two points, making efficient three-point shooting more valuable than mid-range twos.
Volume increases affect game dynamics directly. Each three-point attempt represents a 50% larger scoring swing than a two-point attempt. When both teams shoot high volumes, the cumulative variance across 70-90 combined attempts creates unpredictable scoring patterns that complicate spread predictions.
Team construction now prioritises three-point shooting throughout rosters. Even centres are expected to space the floor. Lineups lacking shooters face defensive schemes that clog the paint. This universal spacing creates more open threes but also more volatile outcomes as shooting percentages fluctuate.
The analytical insight driving this revolution is straightforward: league average three-point percentage around 36% produces roughly 1.08 points per attempt. A mid-range two at 45% produces only 0.90 points per attempt. This efficiency gap incentivises three-point volume despite the lower make rate.
How 3PT Variance Affects Games
Variance frustrated me until I learned to use it rather than fight it. Games deviate from expectations regularly, and three-point shooting explains much of that deviation.
A team shooting 40% from three instead of their 36% average on 40 attempts generates an extra 4.8 points from shooting luck alone. When both teams experience variance in opposite directions, the combined swing can exceed ten points purely from three-point fluctuation. This magnitude rivals home-court advantage and explains many surprising outcomes.
Hot shooting nights create false impressions of team quality. A team winning by fifteen while shooting 45% from three did not necessarily outplay their opponent by fifteen points of skill. Some portion of that margin reflects variance that will not persist. Identifying these inflated margins reveals teams whose records exceed their underlying quality.
Cold shooting similarly distorts perception. A team losing while shooting 28% from three faced poor shooting luck that masked their actual competitiveness. Their next game will likely see regression toward normal percentages, making them potentially undervalued following variance-driven losses.
Dallas Hoops Journal noted that advanced analytics are reshaping professional basketball from the court to the betting window. This observation extends specifically to three-point variance analysis, where sophisticated bettors track expected versus actual three-point outcomes to identify regression candidates.
Three-Pointers and Game Totals
Totals betting changed for me once I understood how three-point dynamics interact with over/under markets.
Average NBA game totals fall between 220 and 224 points in recent seasons, reflecting increased three-point volume compared to historical norms. Higher three-point rates mean more points per possession on makes, though misses from deep produce longer rebounds and potential transition opportunities.
High-volume three-point teams create totals volatility. When they shoot well, games soar past projected totals. When they shoot poorly, the same games crawl under the number. Betting totals involving these teams requires accepting higher variance around any prediction.
Matchup context affects three-point opportunity and efficiency. Some defences allow high three-point volumes while contesting effectively. Others limit attempts but allow higher percentages on available looks. Analysing how defensive schemes interact with offensive tendencies sharpens totals predictions beyond simple team averages.
For comprehensive totals analysis including pace factors, our totals betting guide explains how scoring expectations translate into over/under strategies.
Identifying High-Volume 3PT Teams
Not all three-point shooting carries equal betting implications. Volume and variance interact to create different profiles worth distinguishing.
Teams attempting 40+ threes per game experience the highest variance. Their game-to-game scoring fluctuates dramatically based on shooting luck. Betting these teams requires comfort with unpredictable outcomes and recognition that any single game tells you little about their underlying quality.
Three-point attempt rate, or the percentage of shots taken from three, reveals offensive philosophy more clearly than raw volume. A team shooting 45% of their attempts from three constructs their entire offence around perimeter shooting. Their success depends more heavily on three-point outcomes than a team at 35%.
Shooter quality distribution matters for variance assessment. A team with five reliable shooters experiences more consistent three-point production than one relying on two elite shooters and three poor ones. Rotation depth in shooting stabilises outcomes and reduces game-to-game volatility.
Defensive three-point metrics reveal the other half of variance exposure. Teams allowing high opponent three-point volumes face outcomes partially determined by opponent shooting luck. Games involving two high-volume teams on both ends of the floor become particularly unpredictable.
Tracking expected three-point outcomes based on shot quality versus actual results identifies teams running hot or cold. Open threes convert at higher rates than contested ones. Teams exceeding expected conversion rates face regression. Teams underperforming shot quality stand to improve. This analysis provides regression targets for spread and totals betting.
Building three-point analysis into your pre-game research improves both spread and totals predictions. Check recent three-point shooting percentages against season averages. Note which teams face regression in either direction. Factor these expectations into your line assessments alongside traditional handicapping.
Understanding that three-point variance introduces randomness helps manage expectations about betting outcomes. Even correct analysis will produce losses when shooting luck dominates. Accepting this reality prevents overreaction to results driven by factors no analysis could predict.
Building a systematic approach to three-point analysis requires consistent data sources and tracking methodology. Monitor shot quality metrics alongside raw percentages. Track expected versus actual conversions weekly. Over time, patterns emerge that inform your regression expectations for upcoming games.
Three-Point Betting FAQ
Articles
Published by the betusnba_com team.
